Detect issues faster and improve system reliability with real-time observability and monitoring.
Observability & Data Monitoring
How Syone helps you improve performance and reduce downtime with observability and data monitoring
Syone provides real-time visibility into your systems, applications, and infrastructure using advanced observability and monitoring tools like Elastic, Zabbix, and Grafana.
By detecting anomalies early, reducing mean time to resolution (MTTR), and identifying root causes faster, we enable your teams to minimize downtime, optimize system performance, and stay ahead of disruptions.
Do you have full visibility of your IT systems to act fast and perform better?
Get real-time visibility into your systems with Syone’s Observability & Data Monitoring services. Prevent downtime, solve issues quicker, and make smarter decisions backed by data.
Download One-Pager
Why choose our Observability & Data Monitoring services?
Syone helps reduce Mean Time To Resolution (MTTR) by identifying anomalies early and quickly restoring services to minimize downtime.
Monitor user behavior and app performance in real time to proactively fix issues and ensure a smoother digital experience.
Analyze logs, metrics, and traces to uncover performance trends, detect bottlenecks, and support faster, evidence-based decisions across your IT environment.
Give all stakeholders a shared, unified view of system health and performance. With customizable monitoring dashboards, teams can communicate more effectively, reduce back-and-forth, and resolve issues faster.
Smarter operations through advanced observability & data monitoring.
Detect issues early, improve performance, and ensure system reliability.
Monitor Logs, Solve Faster
Monitor Logs, Solve Faster
Get full visibility into your system’s health with centralized log analysis. Syone helps detect anomalies early, resolve issues faster, and improve performance, security, and compliance across your infrastructure.
App Monitoring, Faster Fixes
App Monitoring, Faster Fixes
Syone uses APM with OpenTelemetry, distributed tracing, and AI analytics to monitor cloud-native apps, detect issues, and improve code quality, enabling faster debugging and more reliable delivery.
Track & Analyze,In Real-Time
Track & Analyze,In Real-Time
Syone delivers full-stack infrastructure monitoring using Elastic, Zabbix, and Grafana to centralize metrics, logs, and alerts, improving visibility and reducing mean time to resolution (MTTR).
Case Study
See how Odemira modernized its IT operations with Syone and Zabbix.
Public institutions must deliver fast, reliable digital services. In Odemira, Portugal’s largest municipality, limited IT visibility meant reacting only after issues impacted citizens. By partnering with Syone, the official Zabbix partner in Portugal, Odemira shifted to a smarter, proactive IT approach.
Learn more
Case Study
Improving System Reliability and Performance with Elastic Stack
A major Portuguese utility provider faced challenges managing application performance and scattered logs across a complex system. Partnering with Syone, Elastic’s only official partner in Portugal, they unified their monitoring, reduced noise, and gained clarity and control.
Read Case Study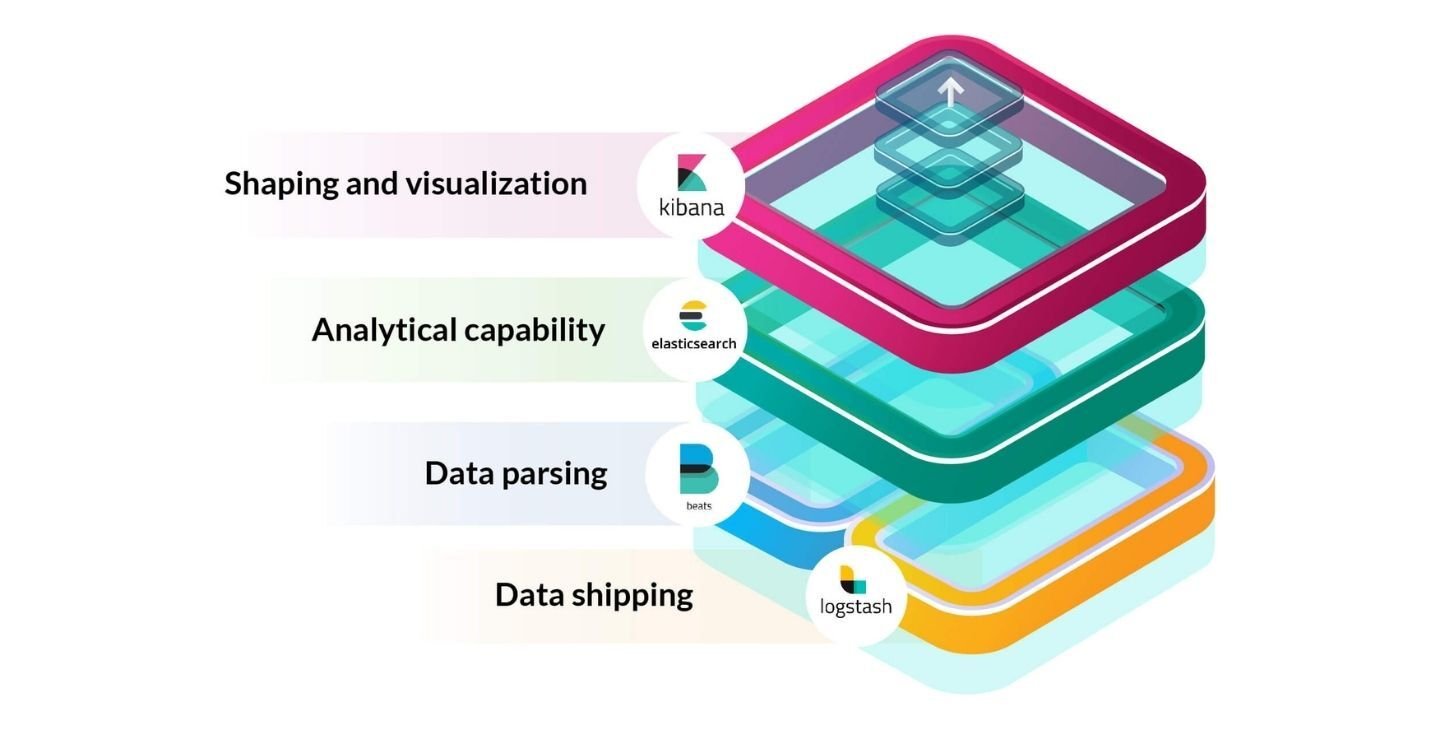
Case Study
Optimizing Financial Infrastructure Monitoring with Zabbix
A financial institution faced downtime and rising costs due to fragmented monitoring and limited visibility. Syone solved this by implementing a unified monitoring solution, boosting efficiency and control.
Learn More
Case Study
Revolutionizing Banking Operations with Centralized Log Monitoring
In banking operations, outdated tools and scattered logs delayed issue detection. Syone delivered a centralized monitoring solution, unifying log management and improving operational efficiency.
Read Full Story
Interested in our Observability & Data Monitoring services?
Fill out the form or book a meeting with our team to explore how we can support your project.
What we do
End-to-end IT services to power innovation and drive digital transformation.
IT Management
Learn moreIT Management
We provide complete IT management, covering infrastructure, monitoring, optimization, security, and incident response, to keep your business running smoothly and securely.
Learn moreDevOps
Learn moreDevOps
Accelerate software delivery with CI/CD pipelines, cloud automation, and DevSecOps best practices to boost agility, reduce risk, and ensure reliable deployments.
Learn moreObservability & Data Monitoring
Learn moreObservability & Data Monitoring
Gain full visibility into your IT systems with real-time analytics, log aggregation, and health monitoring to detect issues faster, minimize downtime, and optimize performance.
Learn moreData, Machine Learning, and Artificial Intelligence
Learn moreData, Machine Learning, and Artificial Intelligence
Turn data into advantage with scalable, intelligent solutions that use data science, predictive analytics, and MLOps to turn insights into action.
Learn moreSoftware Development
Learn moreSoftware Development
Syone develops custom software with UX/UI design, agile methodologies, and continuous integration, from modernizing legacy systems to creating new digital experiences.
Learn moreDigital Transformation
Learn moreDigital Transformation
Navigate the digital landscape with confidence as we modernize systems and strategies by aligning people, processes, and technology to boost agility and drive sustainable growth.
Learn moreSoftware Subscriptions
Learn moreSoftware Subscriptions
We partner with leaders like Red Hat, Zabbix, Elastic, and Microsoft to provide expert support, consulting, and operations, maximizing the value of your software investments.
Learn moreHow we do it
Flexible delivery models to match your strategy and scale your business.


Frequently Asked Questions
IT Managed Services involve outsourcing the day-to-day management and maintenance of your IT systems to a trusted partner like Syone. This includes proactive monitoring, help desk support, infrastructure management, security, backups, and ongoing optimization, ensuring your IT runs smoothly, securely, and efficiently without overloading your internal team.
Costs vary based on the level of service, infrastructure size, support hours (e.g., 8x5 vs. 24x7), and technologies involved. Syone offers scalable, pay-as-you-go and fixed-price models to help you control IT spending while delivering enterprise-grade service at a lower cost than maintaining an in-house team.
Outsourcing to Syone helps you reduce operational costs, increase system uptime, strengthen security, and gain access to certified experts in platforms like Red Hat, Elastic, Zabbix, and Microsoft. You’ll also improve service delivery and ensure predictable IT expenses, freeing your team to focus on innovation instead of firefighting.
Syone’s Service Desk offers responsive, multi-tier support with flexible options: 8x5 helpdesk or full 24x7 incident response with seamless team rotation. We prioritize issues based on severity, provide both remote and onsite assistance, and follow ITSM best practices to ensure quick resolution and business continuity.
We don’t replace your team - we empower it! Syone integrates with your internal staff, covering repetitive or time-consuming tasks like monitoring, patching, and troubleshooting. This allows your in-house team to focus on core business initiatives while we ensure stable, secure IT operations in the background.
Security is embedded into everything we do. From advanced infrastructure monitoring and endpoint protection to compliance controls and automated patch management, Syone helps you detect threats early, prevent breaches, and recover quickly. We also support industry-leading tools like Defender 365 and Azure.
Our onboarding is structured and seamless. We start with a full IT environment assessment, define service scope, set SLAs, and deploy monitoring and support tools. Most businesses are onboarded within weeks, with minimal disruption and full visibility into progress throughout the transition.
Syone’s IT Managed Services are ideal for small to mid-sized businesses that want to scale efficiently, as well as large enterprises seeking to offload operational tasks. We serve multiple industries, from finance and energy to retail and public sector, and adapt to your regulatory, technical, and operational needs.
DevOps is a collaborative approach that bridges software development and IT operations to improve how code is built, tested, and delivered. At Syone, we implement DevOps practices to automate manual processes, reduce time-to-market, and ensure more stable, scalable deployments. This helps our clients ship higher-quality software, faster, with fewer errors and better infrastructure alignment.
Syone works with leading DevOps tools including:
- Azure DevOps and GitLab for version control and CI/CD
- Jenkins for continuous integration and automation
- Ansible and Terraform for configuration management and IaC
- Elastic and Zabbix for monitoring and observability
These tools allow us to build robust DevOps pipelines tailored to each client’s environment.
Syone clients benefit from:
- Faster software delivery through CI/CD pipelines
- Improved reliability with automated testing and deployment
- Better collaboration between development and operations
- Reduced risk with built-in security practices (DevSecOps)
- Higher scalability through infrastructure automation
These outcomes result in better software, faster releases, and more resilient systems.
CI/CD automates the process of testing and deploying software. Syone builds pipelines where code changes are automatically tested (CI) and either delivered to staging or deployed to production (CD). This reduces errors, shortens release cycles, and supports agile, iterative development practices.
Syone specializes in DevOps implementation on cloud platforms like Microsoft Azure. Using Azure DevOps, we enable automated pipelines, infrastructure provisioning, and cloud-native deployments. Our DevOps practices are cloud-ready, secure, and fully adaptable to hybrid or on-prem environments, ensuring flexibility and scalability at every stage.
Containers (e.g., Docker) package applications and their dependencies together, allowing them to run consistently across environments. Unlike virtual machines, containers are lightweight, faster to deploy, and consume fewer resources. Syone helps clients containerize applications and manage them using orchestration platforms like Kubernetes, ensuring agility and scalability.
Security is embedded into every stage of the DevOps lifecycle at Syone. We follow DevSecOps practices, integrating automated vulnerability scanning, access control, and compliance checks into pipelines. Tools like Azure DevOps and Elastic Security help us detect threats early and maintain compliance without delaying delivery.
Monitoring and observability give teams visibility into system performance, deployment health, and user experience. Syone uses Elastic, Zabbix, and Grafana to provide real-time logs, metrics, and alerts. This allows clients to detect issues early, troubleshoot efficiently, and optimize performance continuously.
Monitoring tracks system health and performance using predefined metrics, logs, and alerts. Observability goes deeper using logs, metrics, and traces to understand the internal state of a system and identify root causes before they impact users.
The three pillars are logs, metrics, and traces. Together, they provide a comprehensive picture of how systems behave, allowing teams to detect, troubleshoot, and resolve issues more effectively.
At Syone, we work with Elastic (Elastic Stack) for log aggregation and security analytics, Zabbix for real-time infrastructure monitoring, and Grafana for metrics visualization and dashboarding. We also support OpenTelemetry to standardize data collection across environments.
It depends on your resources and goals. At Syone, we help clients evaluate both routes. Our team specializes in implementing and configuring proven tools like Elastic and Zabbix to accelerate deployment and ensure scalable observability without starting from scratch.
Syone offers both approaches. Managed solutions (like Elastic Cloud) simplify operations and scale easily, while self-hosted options (e.g., on-prem Elastic + Zabbix) provide full control and customization, ideal for organizations with strict compliance or security requirements.
We instrument every layer of your stack, from backend services to cloud-native apps, using distributed tracing, centralized logging, and real-time metrics. Syone ensures your observability layer integrates with hybrid and multi-cloud environments while maintaining performance and visibility.
We recommend using structured logs (e.g., JSON), avoiding sensitive data, defining consistent log levels, and setting up retention policies. For metrics, focus on meaningful KPIs, avoid excessive granularity, and leverage Grafana dashboards for clear visualization.
We configure alert thresholds based on severity and business impact, using correlation and deduplication features (e.g., in Elastic or Zabbix) to reduce noise. Escalation workflows ensure critical issues are surfaced quickly, without overwhelming your teams.
At Syone, our AI and ML services help automate repetitive processes, reduce human error, and extract actionable insights from large volumes of data. This leads to faster decision-making, better forecasting, and measurable business outcomes.
We work with all kinds of data (structured, semi-structured, and unstructured) including logs, call center transcripts, operational data, or documents stored in tools like Microsoft SharePoint. If it holds useful information, we can help you process it for AI and ML.
Yes. Syone helps you assess the quality and usability of your existing data. Notes, transcripts, and even raw text can be transformed, cleaned, and used to train models, often with minimal restructuring.
It depends on your needs. Syone helps assess latency, privacy, and resource constraints to recommend the best deployment model, whether it’s edge computing, on-device inference, or scalable cloud-based infrastructure.
Data protection is a core part of Syone’s approach. We implement privacy-by-design practices, ensure compliance with GDPR and other regulations, and secure your data across all cloud and on-prem environments.
Look for proven experience in integrating data with AI use cases, strong cloud capabilities, and the ability to support projects end-to-end. At Syone, we combine expertise in Azure, open-source platforms, and industry best practices to deliver reliable, scalable solutions.
Yes. Syone participates and provides support to pilot and proof-of-concept projects to validate data, test models, and ensure business fit, before moving to full implementation.
Syone uses cloud-native tools with autoscaling, load balancing, and failover strategies to ensure high availability and real-time responsiveness, critical for data monitoring, observability, or customer-facing systems.
We’ll need details like your business goals, user needs, core features, and any existing systems or processes we’ll be integrating with. If you’re starting from just an idea, we’ll help structure it into a workable plan.
We follow a full-cycle approach: planning, architecture, design, development, testing, deployment, and ongoing support. You’re involved throughout, from kickoff to launch and beyond.
Yes. We offer post-launch support services, maintenance, and performance monitoring to keep your software running smoothly and evolving as needed.
We develop for web, mobile, and desktop platforms using technologies like .NET, Java, JavaScript (Angular, React), and cloud platforms like Azure, among others.
At Syone, we see digital transformation as a way to stay competitive, simplify operations, and adapt to market changes. It helps organizations become more efficient, reduce manual work, and meet changing customer expectations with speed and flexibility.
Our approach includes modernizing systems, automating processes, designing intuitive user experiences, and aligning technology with business goals. It’s not just about tools, but it's about changing how your business works and delivers value.
We begin with a deep dive into your current systems and workflows. From there, we define goals, prioritize opportunities, and build a step-by-step plan to implement the right technologies without disrupting your business.
It depends on the size of the project. Small initiatives can take weeks or months; larger transformations can take longer. We build timelines based on clear milestones, so progress is always measurable.
We use tools like cloud platforms (Azure), AI and ML models, automation frameworks (e.g., Camunda), and modern development stacks: all tailored to your use case.
Syone helps you choose based on what your business needs, not just what’s new. We align technology to your goals, legacy systems, and internal capabilities, ensuring solutions are sustainable and integrated.
We define KPIs with you upfront, like improved performance, cost reduction, or faster workflows. Success is tracked continuously and aligned with your business objectives.
It helps you deliver faster, more consistent, and more personalized interactions, whether through improved interfaces, automated services, or connected systems that respond in real-time.
Yes. Syone is an authorized and certified partner for several leading tech vendors, including Red Hat, Elastic, Zabbix, Microsoft, SUSE, Camunda, and Gitlab. This means all subscriptions are legitimate, supported, and aligned with vendor standards.
We offer the same official plans you'd get from the vendor, but with added value: local support, help with license optimization, and a single point of contact. You'll have the same features and benefits, often with more flexibility and better service.
We handle the activation process end-to-end. Depending on the vendor, you’ll either get direct access to their portal or we’ll manage it on your behalf, always with full transparency.
We support changes at any stage. Whether you need to scale up, reduce costs, or shift to another product tier, we guide you through the process with minimal disruption.
You’ll receive vendor-level support plus Syone’s local assistance. We help with troubleshooting, usage optimization, and escalation, so you’re never left alone with an issue.
We proactively notify you before any renewal, review your needs, and help adjust your plan if necessary, so there's no surprise billing or downtime.
Yes. Most of the platforms we work with are highly flexible. We help ensure your subscriptions integrate smoothly into your existing environment and toolchain.
We act as your partner, not just a reseller. If there’s a technical or service issue, we handle communication with the vendor and work to resolve it quickly, advocating for your business every step of the way.